Operators’ Toolkit for Debugging Microservice Platforms
Introduction
In our webinar The Coming Tsunami in Microservices: Operating Microservices at Scale, we discussed the precipice that some organizations will face as they make significant commitments to microservices. The impact of microservices can be felt from development to operations with new architecture, design and governance to tools and frameworks. Operationally, implementing microservice based architectures can be “one bridge too far” or simply put, beyond the current capabilities of your team. This blog will discuss one important challenge: debugging a failed transaction.
Debugging a Failed Transaction
In the past, with distributed applications, a common approach by operations to debug a failed transaction was to RDP / SSH into the various application servers. It was not uncommon to have 10-15 tabs open in your terminal connecting to the database(s), application server(s), proxy server(s), web server(s).
If we scale this up to a microservice architecture, we could have 10 containers / pods for one domain, 10 containers / pods for another domain, a cloud database, a cloud mem-cache cluster etc. When all the services and containers are calculated, there could be 10s-100s of instances. RDP and SSH will not solve this problem so what can we do?
Correlation identifier
To start, it is important to have each transaction uniquely identified. Regardless of what style of architecture you are using, the correlation identifier is the most critical component of distributed debugging. Examples of how an identifier could appear are:
- Message ID in a message header of a message on a queue
- HTTP Header with a custom identifier
It is the responsibility of the team to generate a unique identifier and then have each technology employed consume / forward this to the next participant. By doing this, each service / container’s log will have a correlation identifier fingerprint.
Log management
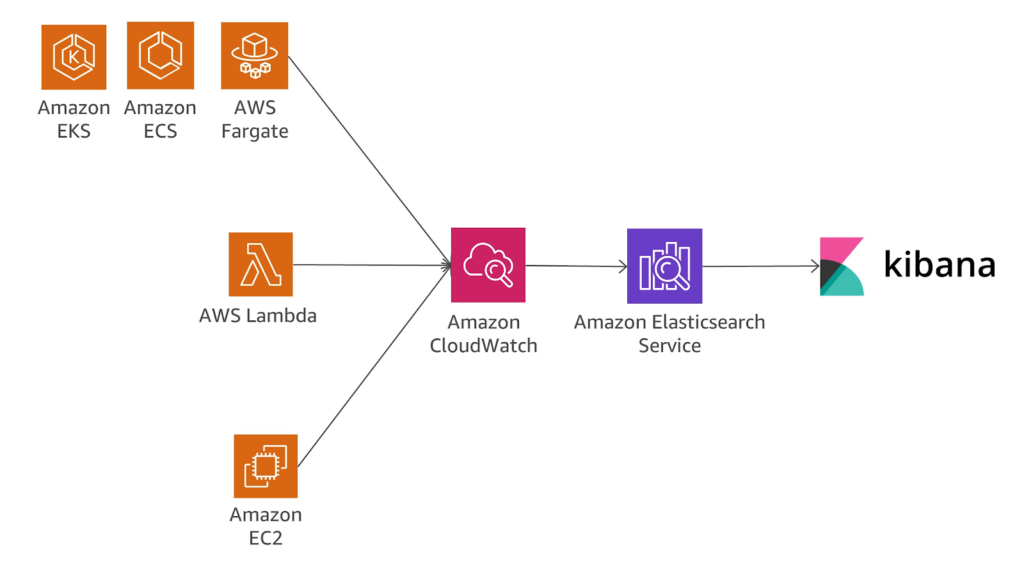
Once messages are being processed by a microservice architecture, applications, databases and other tools are generating logs. These logs by default reside on the servers that the solutions are running on or in the cloud that they are executing within. Tools such as Elasticsearch, CloudWatch, Splunk and others provide a means to forward those logs for indexing, querying and display to help eliminate the significant effort that teams performed previously via RDP, SSH etc. Again, for this process to work well, the applications need to be instrumented to emit relevant events along with the correlation identifier for traceability.
Telemetry
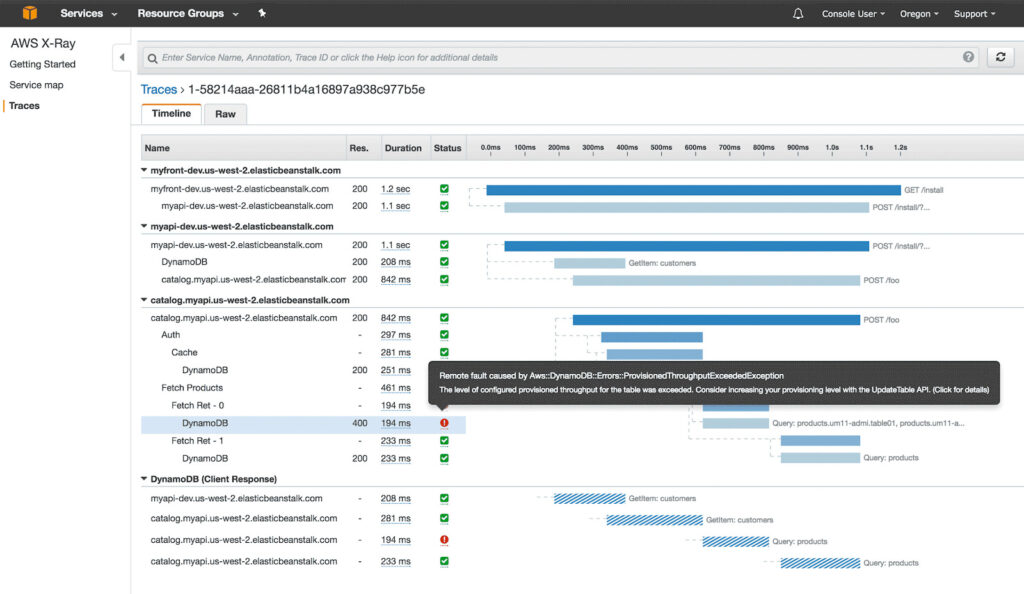
Where log management can help dig deeper into the participating services for a single transaction using the correlation identifier, telemetry can provide a visual representation. This console exposes latency within the various layers of a transaction. Examples include the original receipt at the web server or API gateway layers, the individual lambda functions / containers and finally the data / storage layer. Within AWS, AWS X-Ray provides this information by collecting data from each layer and composing as shown below:
X-Ray provides a series of examples demonstrating how this technology can be plugged in and enabled for teams using AWS.
Service map
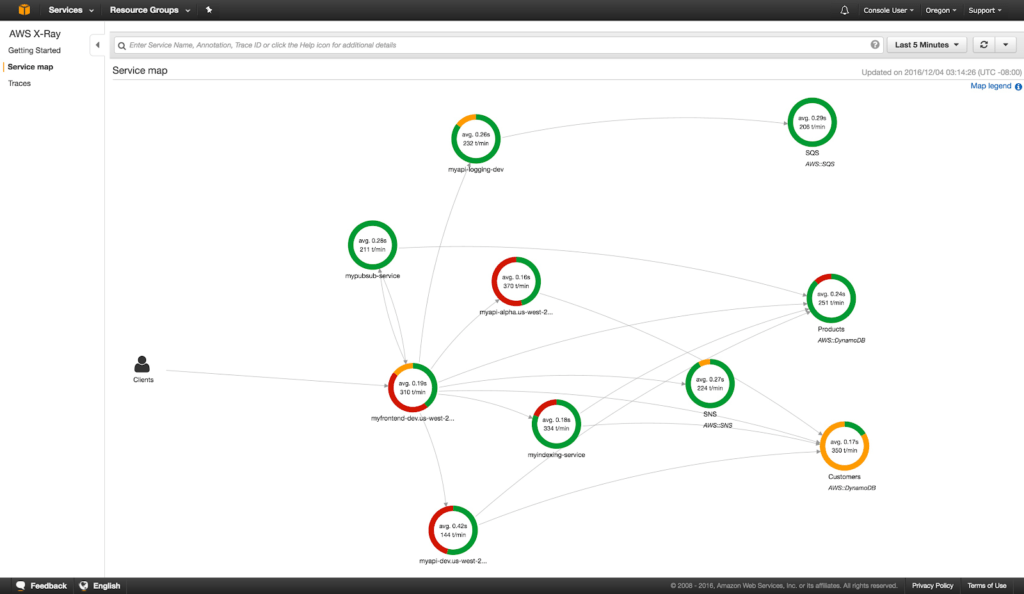
In addition to understanding latency within the architecture real-time, understanding the participants in transactions is also extremely important. Operators can take advantage of Service Maps in X-Ray to visually see the architecture and how they relate to each other. The following image show services that have registered with X-Ray and how they interact with one another.
Kubernetes
Many of today’s microservices architectures leverage containers and container orchestration for production execution of services. If using this infrastructure, there are helpful commands to dig a bit deeper and understand a lower level of abstraction. Using kubectl, operators can get a variety of information. Examples include:
- Examine pod details: kubectl describe pod
- Access logs from a pod: kubectl logs
- Shell into a container: kubectl exec -it
— /bin/bash
Service mesh
Service mesh provides a means of managing the network communication to and from pods, lambda or virtual machines as demonstrated by AWS App Mesh. Technically it employs a side-car proxy running in the same pod as the application. All traffic to a microservice is first received by the App Mesh proxy. The App Mesh proxy provides interesting mechanisms for managing traffic, security and monitoring. Rather than injecting the X-Ray specific code to emit events from your microservice / container, you can configure App Mesh to forward details to X-Ray. This reduces complexity and also opens up the opportunity for implementing self-healing policies. Downstream systems can become flooded and the service mesh can have policies around back pressure and/or circuit breaker to alter traffic in the event services become unresponsive.
Summary
As organizations adopt microservices approaches and migrate from monoliths to a large service catalog, it is important for operators to be an active participant in the migration. Fundamentally understanding the new runtimes employed in microservices and the available services provided by the Public Cloud is critical to success. The previous sections covered a few services and approaches for helping operators be more efficient and effective in delivery.


