ADVANCED ATLASSIAN INSIGHTS W/ OBSERVABILITY PLATFORM
Critical visual insights on your application performance and usage to maximize efficiency
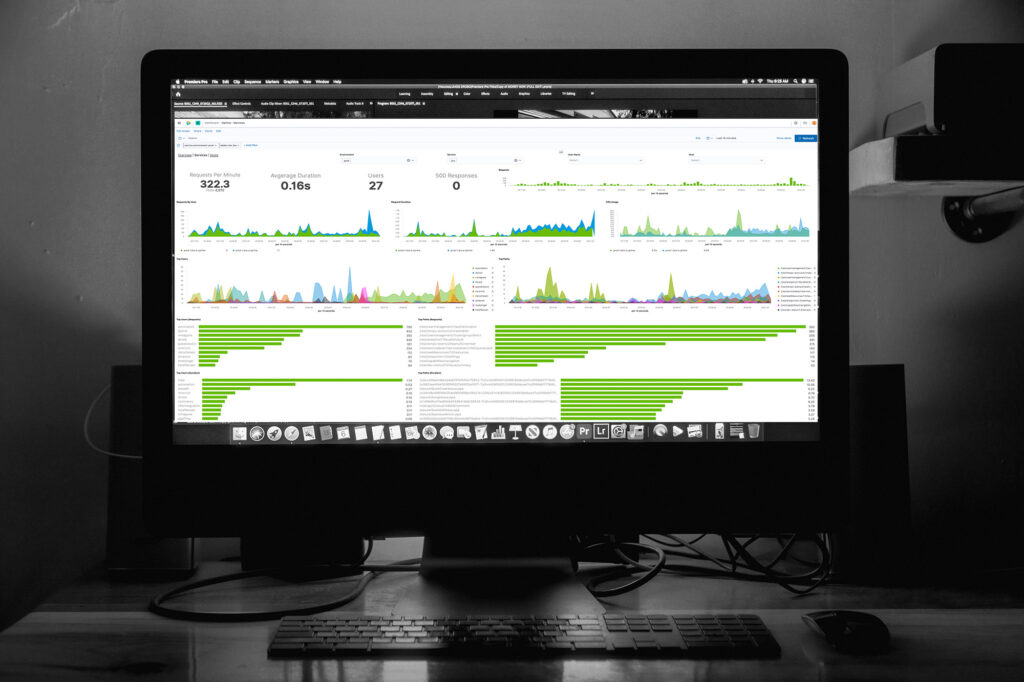

Our Observability platform was born through frequent customer demands for more robust monitoring and observability within the Atlassian Stack. Full transparency and critical visual insights help to identify and resolve issues such as slow response times, outages, etc to maximize efficiency and minimize time to value. The observability platform can be applied to the Atlassian stack or ANY 3rd Party or Custom Application.
How stable are my applications?
Environmental Insights: Application usage and performance data with 1-Click access to system metrics
What are our users doing?
Trace User Activity: Log based queries, specific volume metric, and more
Why is Jira running so slow?
Minimize Time to Value: Assess and resolve slow query response times and stay to top of performance for optimal system monitoring and management
The Solution:
ADVANCED ATLASSIAN INSIGHTS WITH OBSERVABILITY PLATFORM
WATCH THE 2 MINUTE DEMO
Implementation
Use Case Identification
Obtain understanding of business objectives, engagement goals, scope and timeline.
Observability Implementation
Deployment of Elastic use case, advanced value drivers, or end point/ integrations to hosted or non-hosted customers.
Learning and Enablement
Creation of enablement content to empower customer use and adoption.
Ongoing Support
Office Hours
Up to 10 hours of technical guidance to support configuration, integration, deployment and usage.
Use Case Expansion
Ingest additional data sources to aggregate and correlate along side application user data.
Success Check-in
Monitor on-going progress and engagement with Cprime monthly.
Starting Cost
$6k Implementation + Monthly Support fee
Atlassian Health Reports: The Rx Solution for your Atlassian Instance.
Looking for those leadings indicators that highlight potential risk? Looking for quantitative ways improve application quality and drive better process…

Automated Jira & Confluence Health Checks: Boost Operational Efficiency, Productivity and Scale
Looking for those leadings indicators that highlight risk? Looking for quantitative ways to drive better application and process enablement? As…

5 Key Areas to Establish Jira Governance
Throughout our extensive Agile and Atlassian Technology implementation experience, we have identified common team, program and portfolio technology and process…
