The Power of Team Level Reporting in Jira Align (Part 1 of 4)
This is the first blog in a four-part series on the powerful reporting capabilities offered through Atlassian Jira Align (formerly Agilecraft). The series covers Jira Align reports of specific value to agile practitioners at the:
- Team Level
- Program Level
- Portfolio Level
- Enterprise Level
Each segment will briefly cover:
- How Jira Align effectively ties each level into the bigger enterprise picture
- Which stakeholders are most likely to use the reports available at each level
- Which Jira Align reports are likely to be most popular at each level and why
The newest addition to the Atlassian suite of agile solutions is Jira Align, a cloud-based application designed from the ground up to effectively scale an organization’s agile practice all the way from individual development teams to enterprise level. It offers a single source of truth that unifies overarching business goals and strategic planning with day-to-day productivity. It also provides practical visibility into every level of the organization so all stakeholders can work from common, accurate, real-time data.
Here at Cprime, we’re thrilled with how Jira Align rounds out the Atlassian suite so effectively. It provides a technological framework that perfectly supports the agile scaling principles we’ve used for years to guide our clients through that challenging but rewarding process. That’s why we’ve developed an entire capabilities set in our own practice around effectively implementing Jira Align and using it as a basis for successful scaling of agile at large companies.
Learn more about Cprime’s solutions around Jira Align
At its core, Jira Align is a data aggregator that accepts inputs from numerous team productivity tracking tools, including the classic Atlassian Jira platform, as well as manual entry. The application then takes all the data being collected and produces hundreds of reports that promote transparency, support continuous improvement, enhance processes, and power effective decision making at every level of the organization.
How Jira Align Ties Individual Teams Into the Full Enterprise
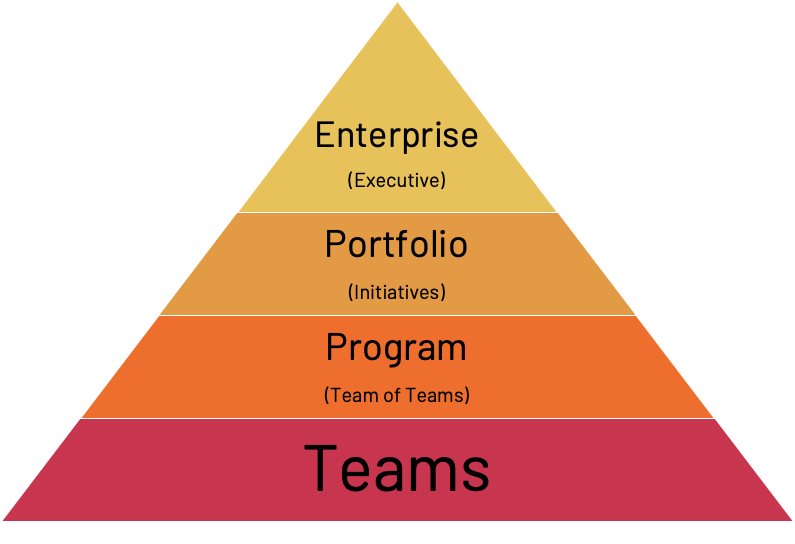
With that concept in mind, we can start by picturing the full enterprise as a pyramid:
As you can see, all the individual development teams that are in the trenches getting work done day in and day out make up the solid foundation of the structure. That’s because, for the entire enterprise to take advantage of agile at scale, the strategic initiatives coming down from the executives must be effectively communicated to — and guide the daily activity of — those teams. Likewise, all the data generated as team members do the work needs to filter up to stakeholders at each level so decisions can be made, steering can be adjusted, and everyone can verify success is being achieved.
Jira Align’s reporting capabilities provide exactly that sort of top-down AND bottom-up visibility to facilitate organizational alignment in real time.
Which Stakeholders Will Benefit From Team Level Reporting in Jira Align?
Theoretically, everyone in the organization can benefit from being able to access real-time data at the team level where strategic management and planning are translated into productive action and results can be observed on an hour-to-hour basis, if necessary.
In more practical terms, however, the roles likely to spend the most time poring over team level reports in Jira Align include:
- Scrum masters
- Team leads
- Product owners
- Product managers
- Portfolio managers (on occasion)
As we look into some specific team level reports, we’ll highlight why these individuals may want to access the information they contain and how they can use it.
Examples of Popular Team Level Reports in Jira Align
The following reports are among the most popular among Jira Align users, often because they provide wide-ranging snapshots of team level activity across one or more sprints. It’s important to note, of course, that Jira Align also contains dozens of additional pre-formatted reports that get even more granular when a deeper dive is required. And, custom reporting is easy to setup in case users are looking for specific insights the established reports don’t offer.
Team Room
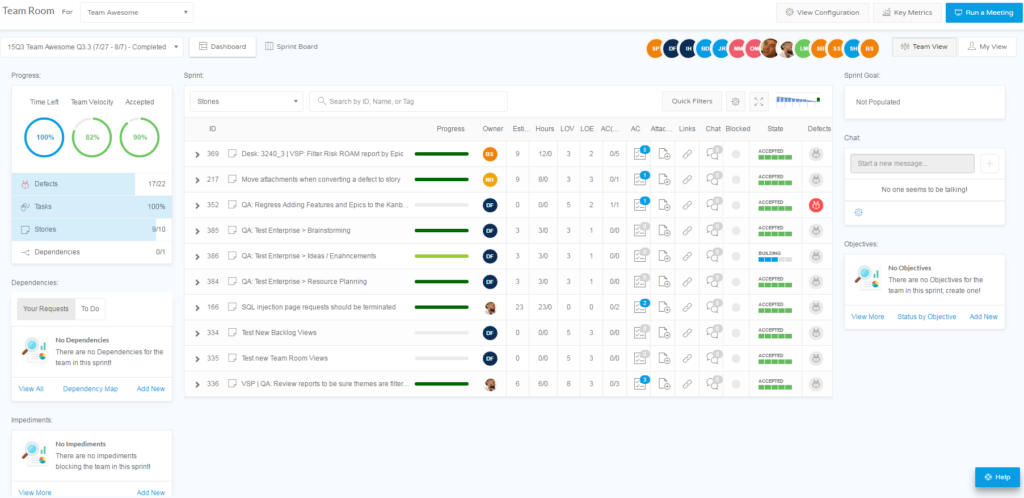
Figure 2 – Team Room Report – The optimal “home base” for Product Managers and Scrum Masters in Jira Align
The Team Room serves as an optimal “home base” for Product Managers and Scrum Masters in Jira Align. In this one interconnected set of reports and views, they will find just about everything they need to carry out their day-to-day tasks, keep their finger on the pulse of the team, and make necessary decisions quickly and confidently.
With both a dashboard view and a classic Kanban-style sprint board view, all this data is easily accessible:
- Stories, tasks, and defects
- Progress
- Dependencies
- Impediments
- Sprint goal
- Objectives
With this information, Product Managers and Scrum Masters can:
- Adjust priorities and staffing on-the-fly as needs arise
- Run an efficient and informative Daily Standup
- Quickly access snapshot data to report to other stakeholders
Sprint Metrics Report
The Sprint Metrics report offers a grid-based view of all teams’ performance across any sprints that fall within the same planning increment (PI). It’s an excellent overview report that highlights:
- How different teams compare to each other across several qualitative and quantitative metrics
- How a series of consecutive sprints within the PI are trending
- Where adjustments may be needed to ensure longer-term PI goals will be met
As such, it’s especially useful as a visual basis for discussion during sprint planning meetings, retrospectives, and post-PI meetings. Scrum masters, team leads, product owners, and program managers are generally called on to plan for and/or facilitate these meetings. They are therefore likely to use the Sprint Metrics report the most. Actively engaged portfolio managers may even pull it on occasion to get a quick glance of the overall health of the programs under their purview.
Report Details
The report includes the following “views” — groupings of data designed to provide a specific insight — among others. These sections of the report can be reordered to meet the user’s preferences and priorities:
- Team Emotion – Subjective record of how the team is feeling about the work and/or the process. Look for trends to get ahead of potential problems via coaching or intervention.
- Team Objectives – How consistently is each team meetings its objectives? Look for trends to determine if the team needs more or less work, or if there are underlying issues blocking optimal productivity.
- Story Completion – Each team commits to completing a certain number of stories during each sprint. If a team fails to do so regularly, it may indicate the need for intervention to improve productivity or to help the team better estimate their workload.
- Splits & Drops – Ideally, no stories should be split or dropped during a sprint. If a team does this regularly, it’s a sign of estimating problems, either of story complexity or sprint commitment.
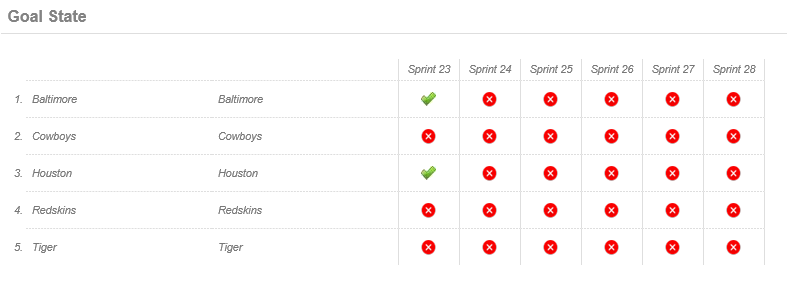
- Goal State – Is the team meeting their sprint goals on a regular basis? If they always meet every goal, they’re likely not stretching enough. If a team rarely reaches their goals, they’re either overreaching or the goals aren’t truly theirs to begin with. Both issues can lead to demotivated teams.
Many of the metrics highlighted in this report are clickable, allowing the user to drill down deeper into the data, or to pull up a closely related report, the Sprint Coaching report.
Sprint Coaching report
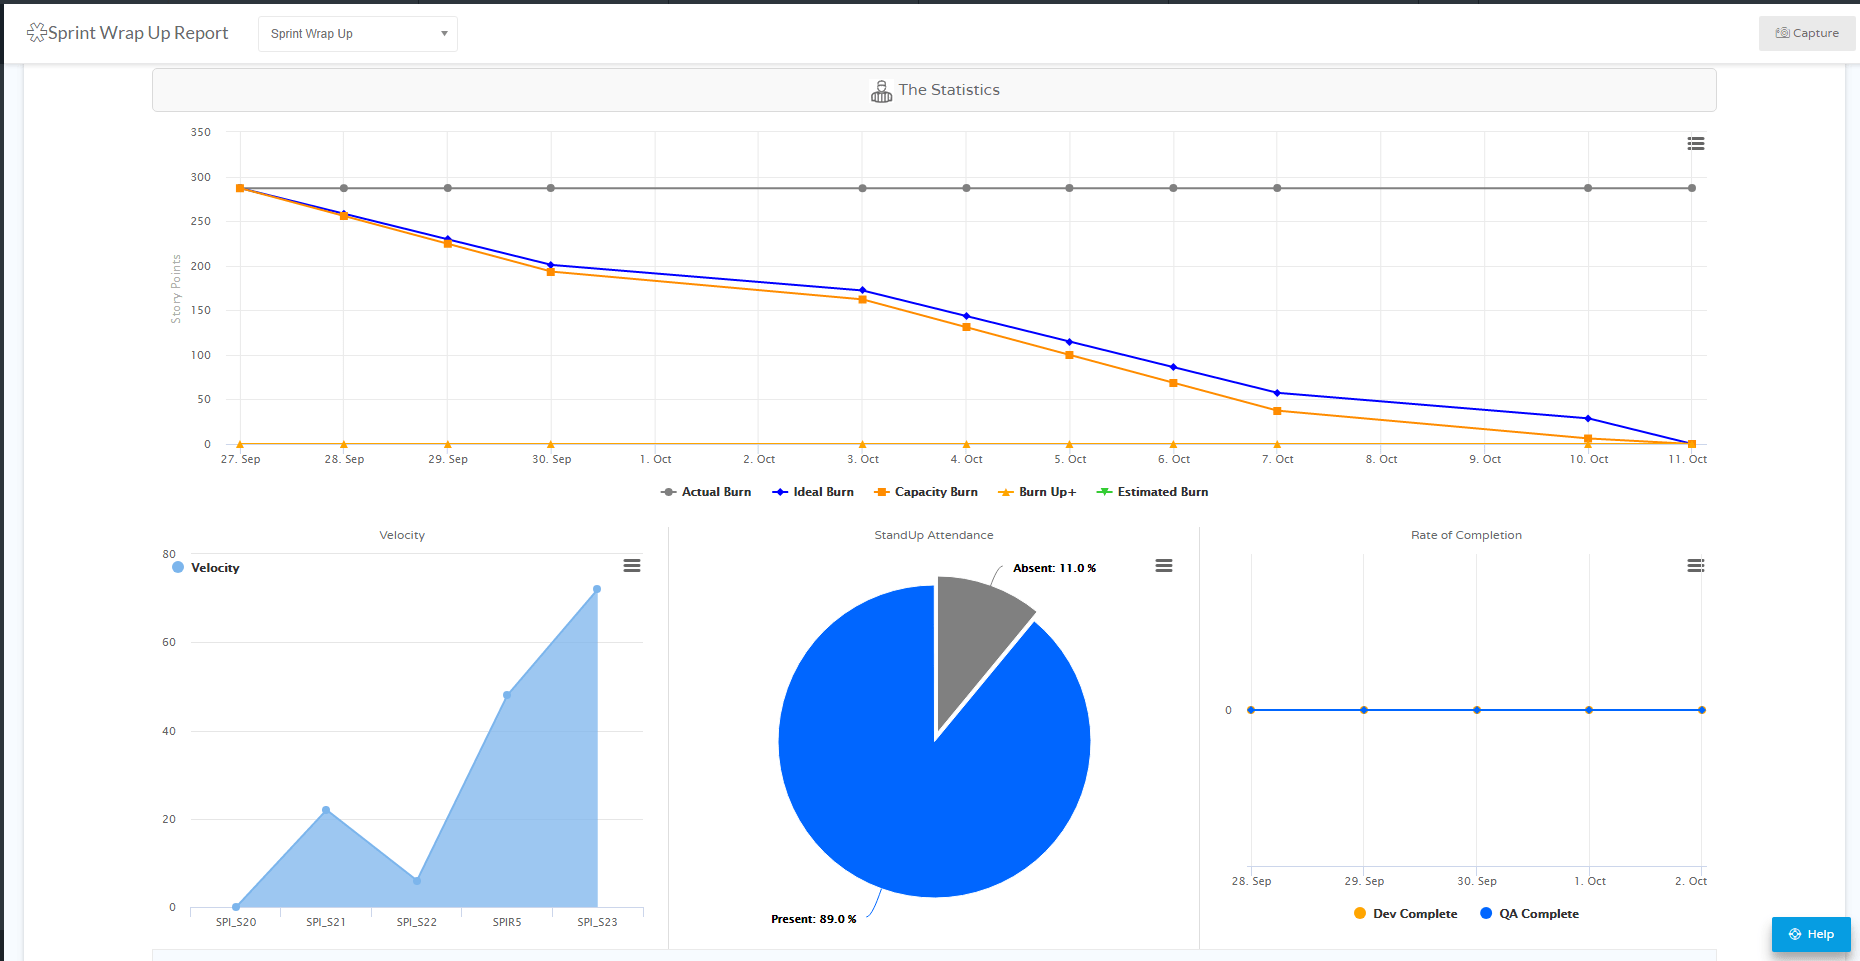
The Sprint Coaching report combines highly visual charts and graphs that compare and contrast the established sprint plan and objectives with actual results once the sprint is done. It “tells the story” of each sprint, making it a natural report to pull up during retrospectives. It highlights:
- The sprint’s established goals and objectives
- Each team’s performance against those goals and objectives
- Each team member’s contribution to the team’s overall performance
As noted above, many of the views in the Sprint Metrics report will link to the particular sprint’s Sprint Coaching report for further insight. This allows stakeholders to move from generalized trends over several sprints to sprint specific data, helping to identify outliers and confirm suspected issues to address. When consulted during a sprint, the Sprint Coaching report also displays forecasted velocity and burndown based on what’s occurred thus far in the sprint.
Scrum masters, team leads, and product owners will all be heavily invested in this report as it offers an excellent basis for promoting continuous improvement at the individual team level, which has its place in every sprint planning session as well as retrospectives.
Report Details
Here are some of the views included in this report:
- Sprint Goal/Objectives – The main objectives the team committed to at the beginning of the sprint.
- Committed Plan – A more granular outline of commitments made during sprint planning, such as user stories, task hours, and effort and value points.
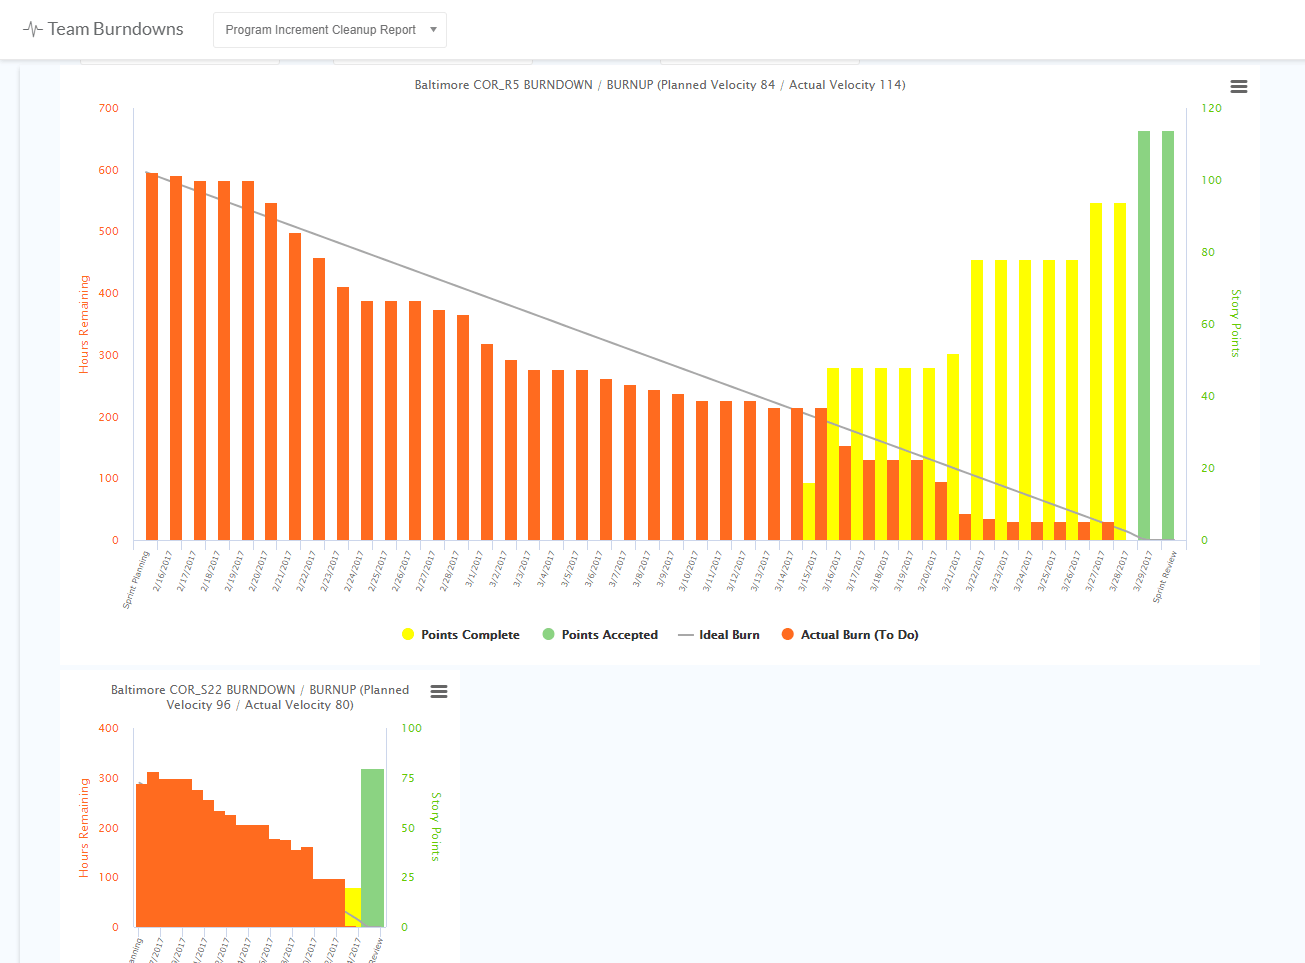
- Burndown Chart – Displays how task hours are burnt down in the sprint compared to the ideal. If the sprint is not yet complete, this chart also shows the Estimated Remaining Burn.
- Velocity Chart – The velocity for the team over the past several sprints.
- Standup Attendance – This can potentially identify unengaged team members or highlight needed improvements in standup meeting quality.
- Sprint Story Progress – A complete view of progress across all committed stories: progress bars, story health, acceptance criteria, value points, effort points, and the total number of hours spent.
Capacity Planning report
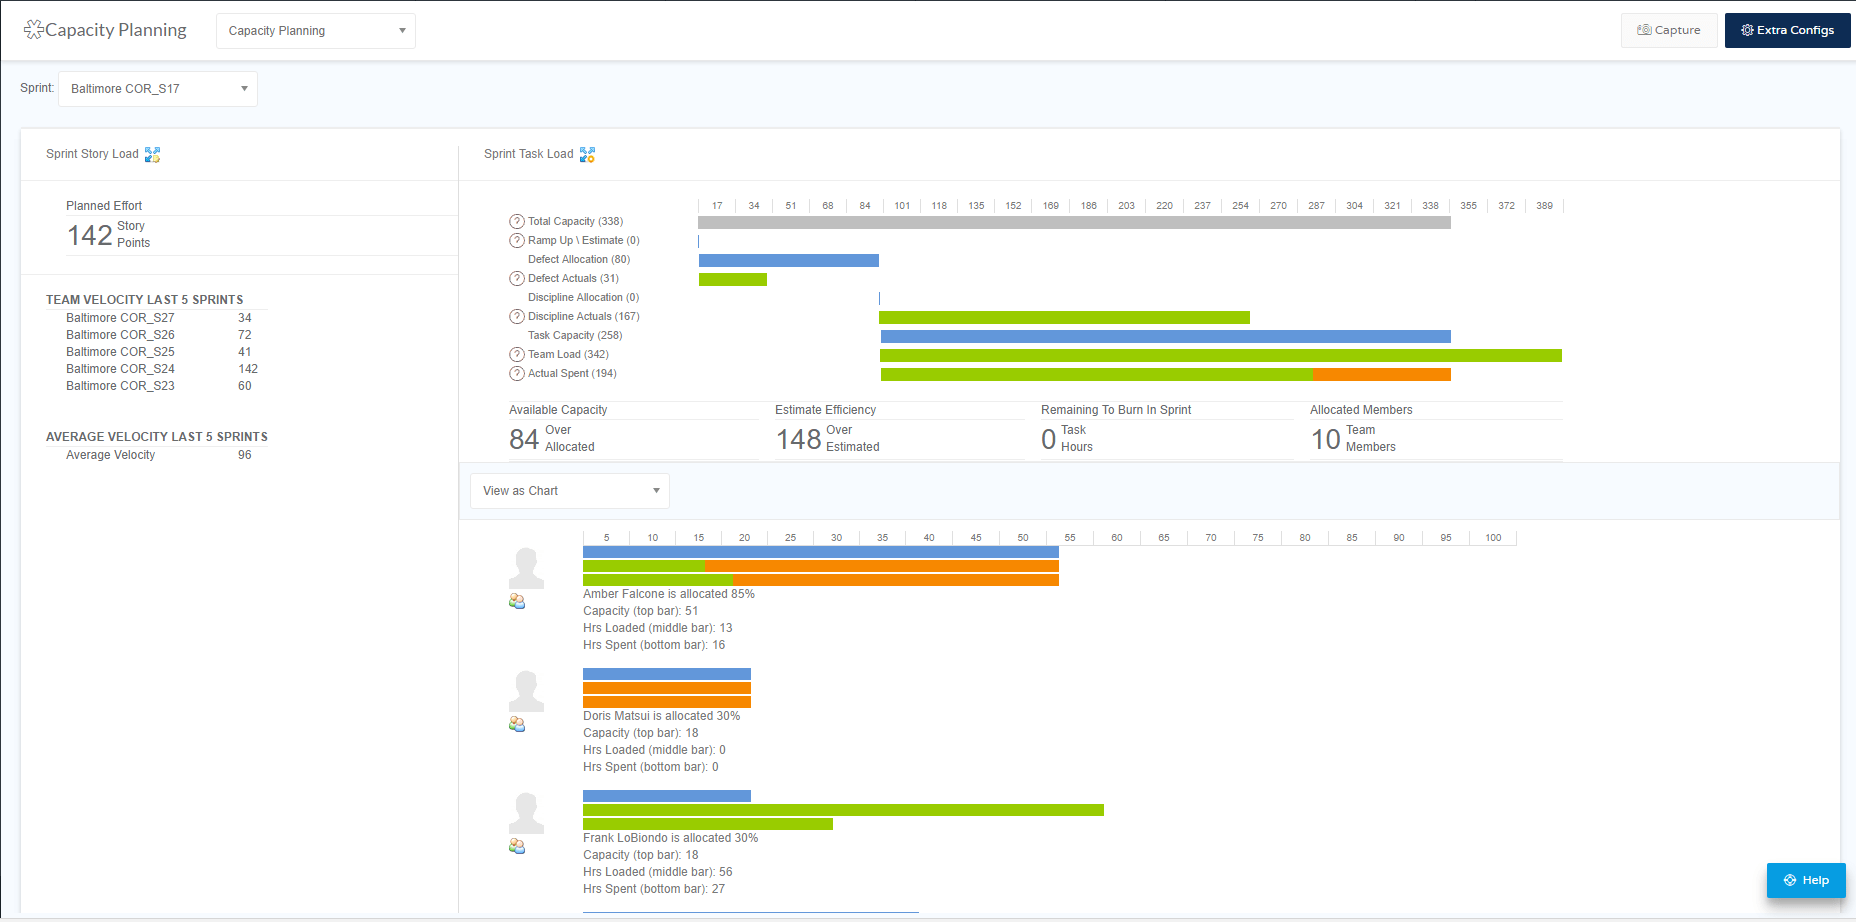
The Capacity Planning report brings together the current and historical information Scrum masters need for effective sprint planning, answering these vital questions:
- Can we make commitments for our team?
- Is the work equally distributed among team members?
- Are we estimating the work appropriately?
Just as the Sprint Coaching report tells the story of the sprint just past, the Capacity Planning report tells the story of the sprint to come. It’s a valuable resource that not only facilitates practical task management and story assignments for the team, but also provides insights from past sprints to help the team determine what they can realistically take on.
Report Details
The following charts and graphs are included in the Capacity Planning report:
- Team Velocity Last 5 Sprints – These are the accepted story points the team completed during the previous five sprints — a valid predictor of what the team can realistically commit to this sprint.
- Sprint Task Load – A roll up of team capacity, hours team members have already committed to other tasks, adjusted capacity, the task hours currently loaded for this sprint and actual hours spent on tasks. As a sprint commences, this chart is continually updated, offering real time sprint status.
- Available Capacity – A quick glance lets you know whether your team is over or under allocated, and by how much. Most capacity planning activities center around using the Sprint Task Load data to equalize the Available Capacity numbers.
- Individual Team Members – The bottom section of the report breaks down each team member with allocation percentages, available capacity, assigned tasks, actual hours to complete tasks, remaining tasks in hours, and remaining capacity. These numbers should start out as close to equal as possible, but offer fair warning of reallocation needs as the sprint progresses.
Team Burndown and Velocity Trend reports
These classic agile artifacts are not unique to Jira Align, but they’re present and accounted for as any agile practitioner would expect. Both of these simple reports will be routinely referenced by Scrum Masters, team leads, and product owners both as real-time and historical documents of team performance:
- The Team Burndown report highlights the number of story points assigned to the team for a given sprint, the stories completed, and those remaining to be completed by the sprint’s end. It provides a high-level understanding of whether the work for a sprint is on track. It may be beneficial to review the report with team members and stakeholders during sprint retrospectives and daily standup meetings.
- The Velocity Trend report aggregates the same basic information, but in terms of how well the team has historically completed stories in each sprint compared to what was expected. It is beneficial to review the report regularly to assist in making future work commitments for highly predictable teams. As well, it can help to identify any negative trends early.
In the next installment of this series, we’ll dive into the most popular program level Jira Align reports. If you’d like to learn more about how Jira Align can help your organization, we’d love to hear from you.
