Burn Baby Burn… 5 Jira Software Burn Up Hacks for Program Managers and PMO’s
We are living in world of over used metrics and reports that tell us nothing. Every position is forced to verify and validate their efforts or be burned at the stake. So, how did we even get here?
I thought Agile was supposed to get us less documentation and teams that decided what to do on their own time without having to report anything. Well… as long as program managers have to promise dates, management will demand traceability and metrics.
So, what is the easiest way to visualize the most important metrics and how do I cut through the clutter and get to what is important? The fact is, one needs to start with a Burn Up Chart.
Introducing the Project and JQL Burn Up Chart for Jira
This Jira dashboard gadget will probably save you 40 hours a month from cobbling this together in Excel. After all, doesn’t the data already exist in Jira? The Project Burn Up Chart for Jira allows you the ability to understand effort accumulating over time. It is tied to your iterations so it gives you an ability to see your planned points in the release alongside what you are actually closing out during each sprint or iteration.
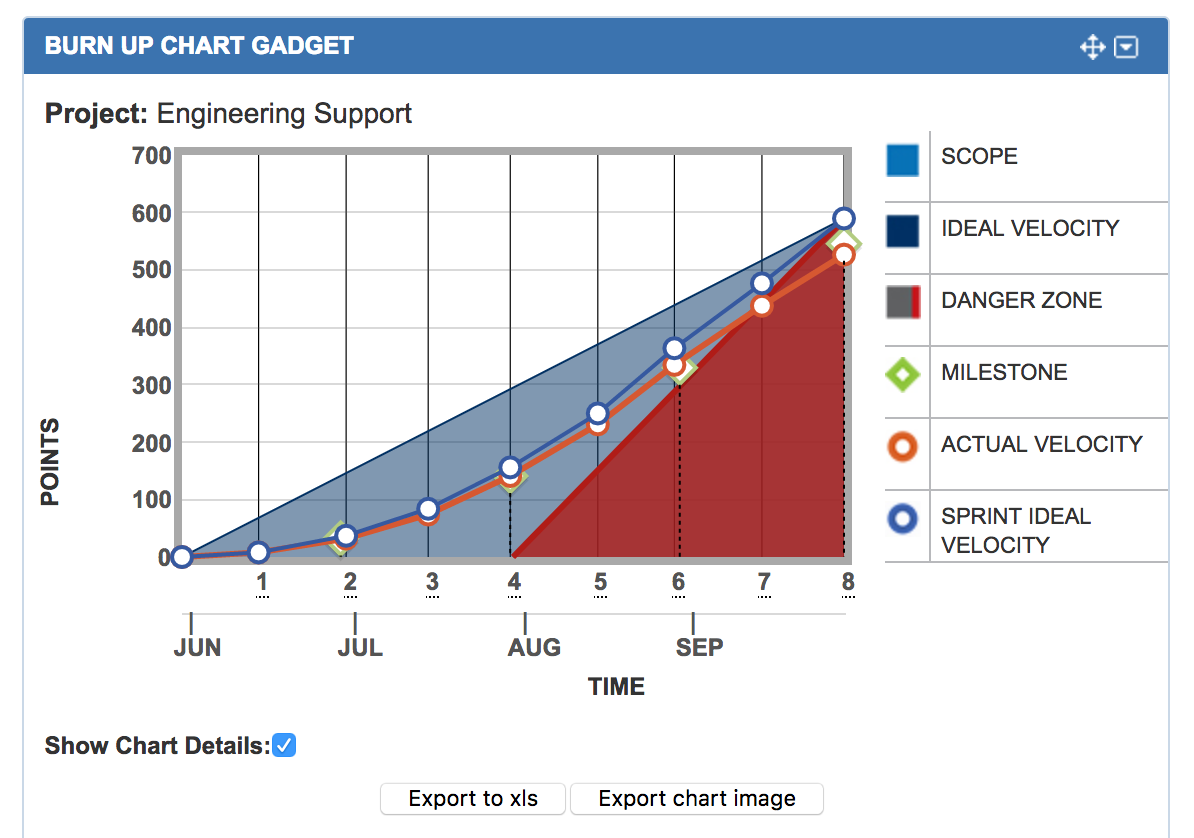
Let’s look at the visual chart specifics:
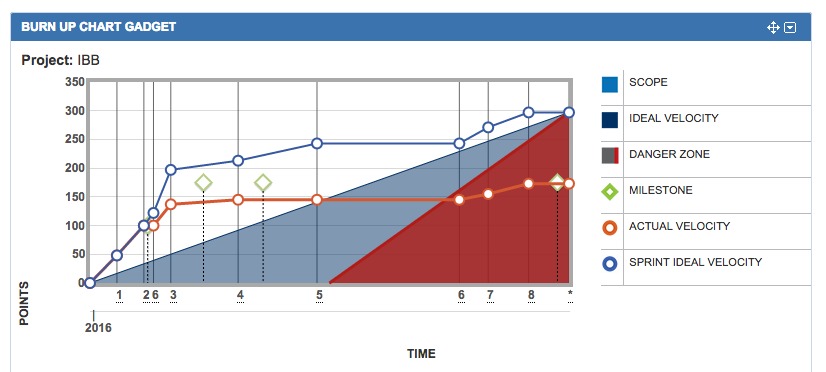
- On the x-axis, we are plotting your iterations over time. (Here this would be your Jira sprint containers.)
- On the y-axis, we are plotting accumulated completion of your work. Here this would be story points or hours. (Think of this as your value delivered over time.)
- We are also showing a buffer zone, enabling us to set a lower limit threshold of sorts to show where we may be getting dangerously close to putting our release in jeopardy. (For example, let’s assume we set a buffer limit at 20% below the ideal burn up line. When a project starts to trend off the plan, we can show the scope bleeding into the danger zone enabling you to take action.)
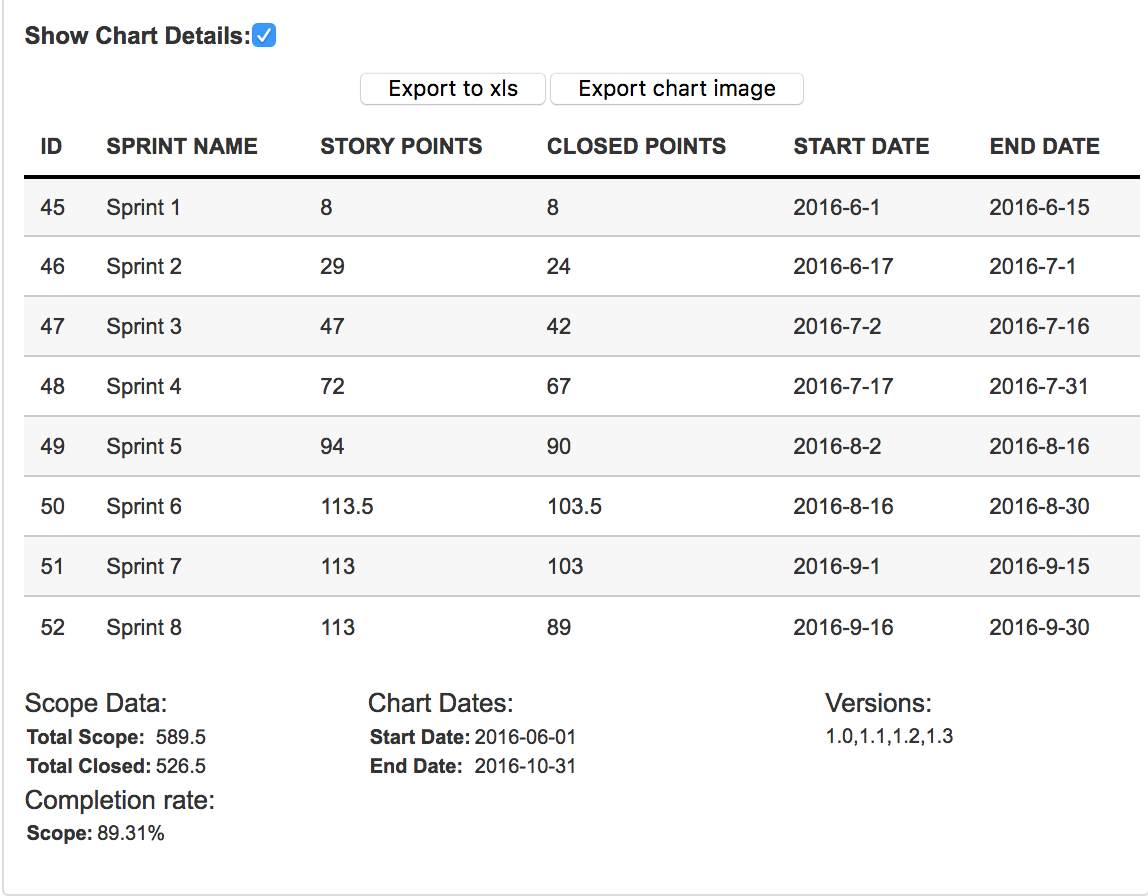
Let’s look at the selected detailed chart specifics:
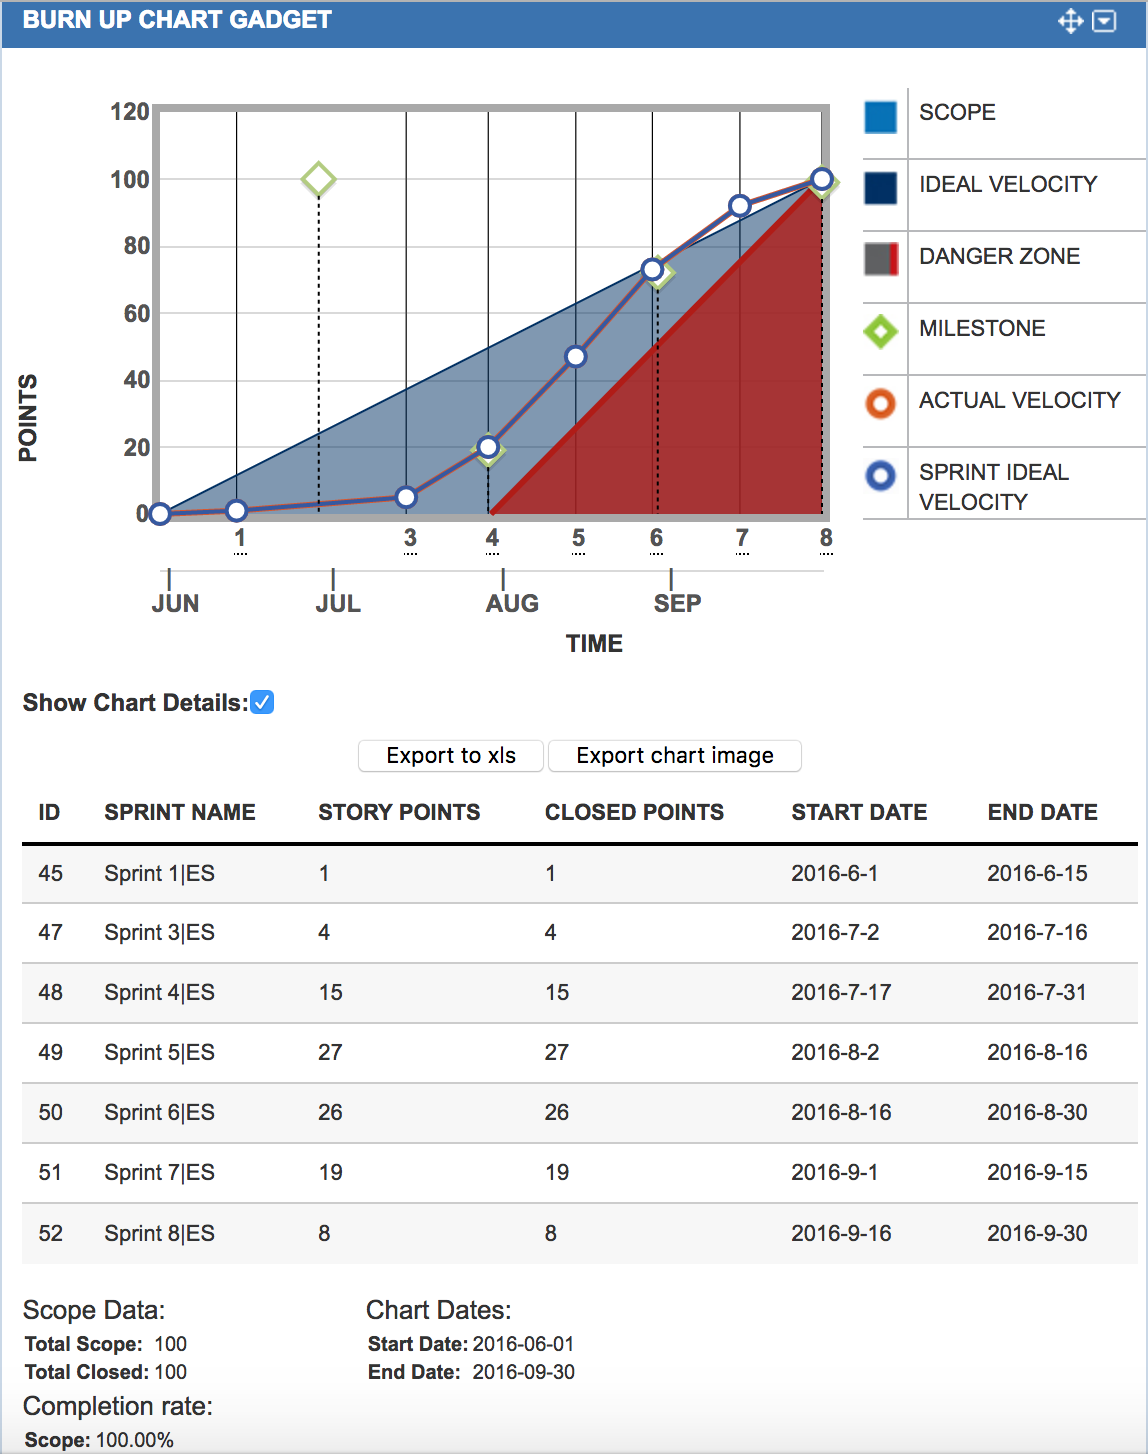
When you toggle to show chart details, we are seeing a granular drill down into:
- The sprint ID, the sprint name and the sprint start and end dates.
- We are also showing planned story points we planned into each sprint container.
- Finally we show how many points we actually closed out against this plan as the sprint ended.
The Aggregated Metrics:
- Total Scope: here we have a desire to see meaningful metrics like total planned scope, (in points or hours)
- Total Closed Scope: here we show a summary of points or hours that was actually closed out. (How many points did we close this release?)
- Percentage Completion Rate: Here we are looking at the ratio of planned vs actual to get a completion rate. (How done are we from a percentage completeness perspective?)
The Fundamental 5 Types of Burn Up Charts to Visualize in Jira
1 – Burn Up By Release
Wouldn’t it be great to report to your management team that you planned for 600 points but only have delivered 580 with two weeks left in your release? 96% complete should make you feel pretty damn good as long as nobody adds 200 more points over the next iteration.
In addition, the report allows you to burn up a specific epic or team if you want to granularly peel the layer of the onion down and deep dive into specific chunks of work.
2 – Burn Up by Team
Wouldn’t it be great to get a cross team or cross project view from a JQL query and show the Burn Up against this factor? In this request, we see users using a Jira custom field called “Team.” If you are using teams data, please use a JQL filter, save the filter and share the filter so that you can use this in our gadget. Here is an example of this type of query:
Project = Engineering Support AND fixVersion = “iOS” AND Component in (“Team – Avengers Team 1”) AND type in (Story, Spike) AND key = ENG-6539
or:
Project = Engineering Support AND fixVersion = “Android” AND CF(001234) = “Team – Incredibles”) AND type in (Story, Spike) AND key = ENG-6540
NOTE: Please ensure you are using all points or all hours. Please don’t mix up your effort measures or you won’t be able to normalize anything let alone draw anything.
3 – Burn Up By Epic
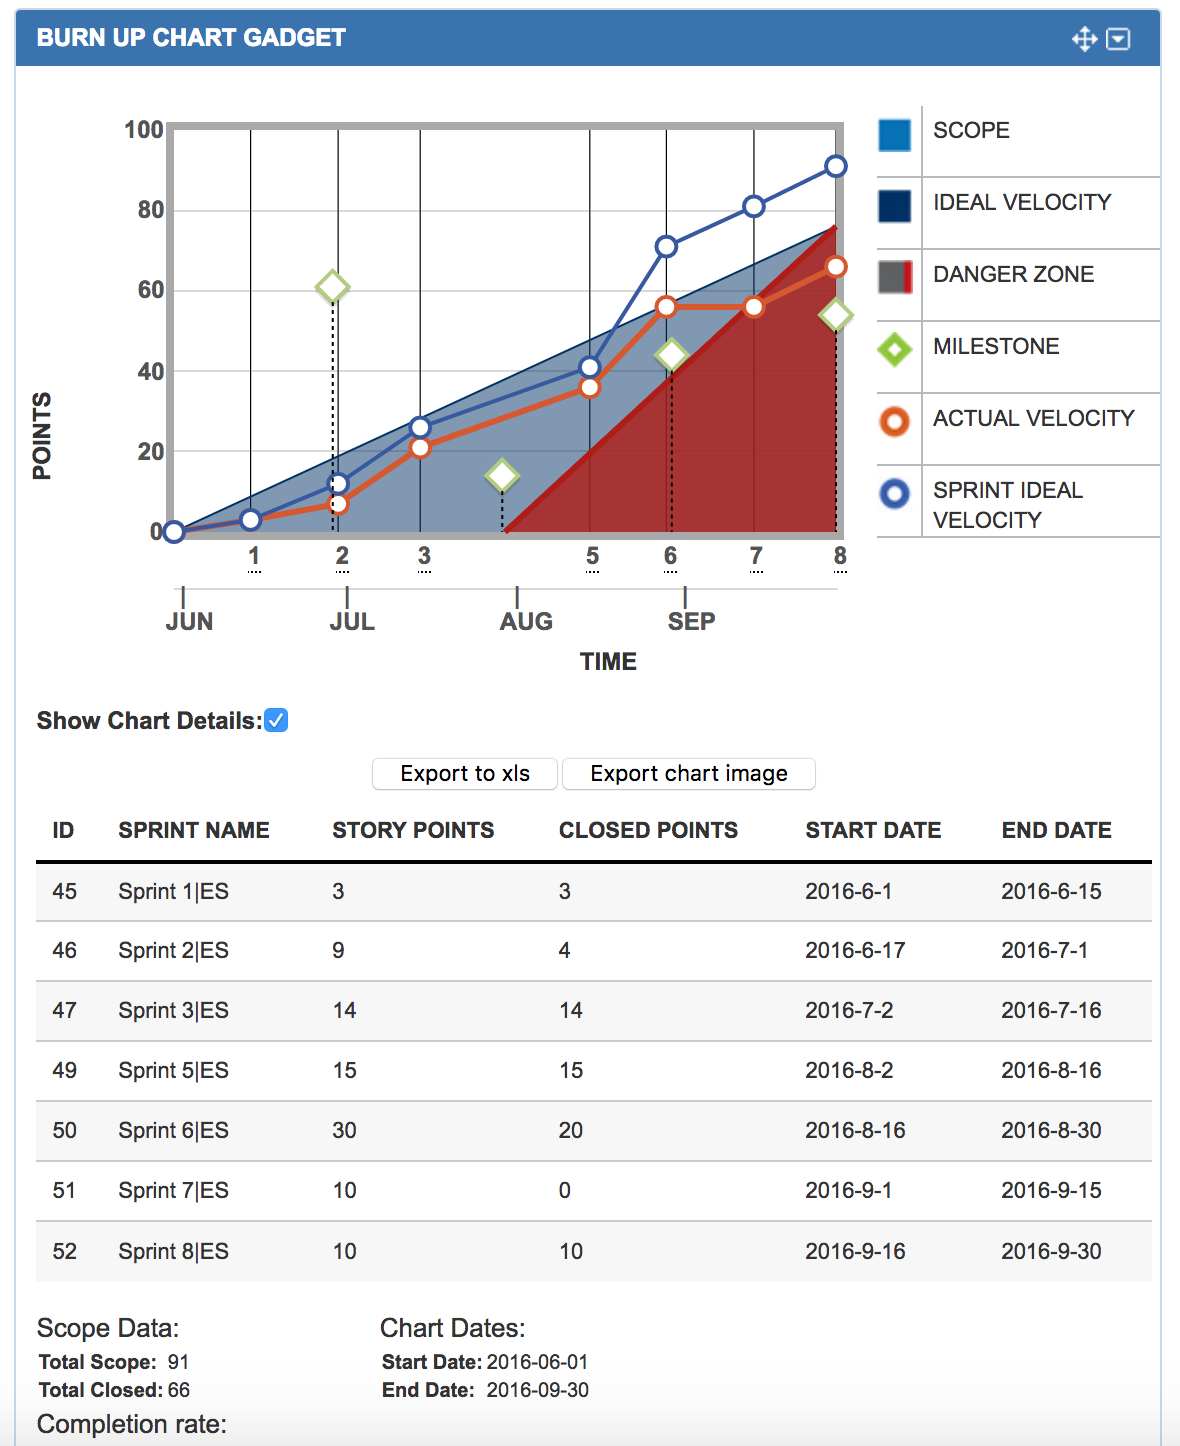
Maybe you want to dive into just one Epic and see the burn up chart for just your Admin / Permissions Epic. Here you can create a JQL saved filter and add it as a burn up chart to show burn up progress against just this epic. Wouldn’t it be great to show an overall completeness of your epic to show that you are 73% complete against your Admin/Permission epic and that you fell behind in Sprint 7 and were not able to complete any points as a new batch of work became priority.
4 – Burn Up By fixVersion
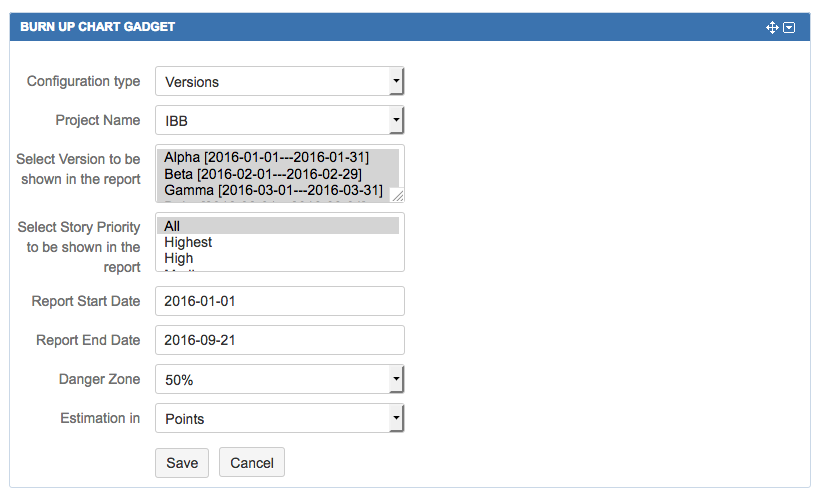
In this Burn Up chart, please select a fixVersion configuration value, and then select your Jira project name. Next, select your specific FixVersions to include in the burn up chart date ranges. Next, use your priority field values to as a sub filter to include or exclude the priority of issue types that are relevant. Finally select your relevant date ranges, set your buffer limit and select save to render your fixVersion Burn up chart.
The items in green are target milestones or fixVersions based on groups of work. These values are based on end date.
Helpful Indicators to look out for
- Scope lines that are increasing or deviating away from each other.
- Scope that increases and drops abruptly.
- Sprints where there was no work completed – did something creep in? New priority?
- Velocity – are you trending up or down? Are you over loaded or under loaded?
